


0
US Dollar Index
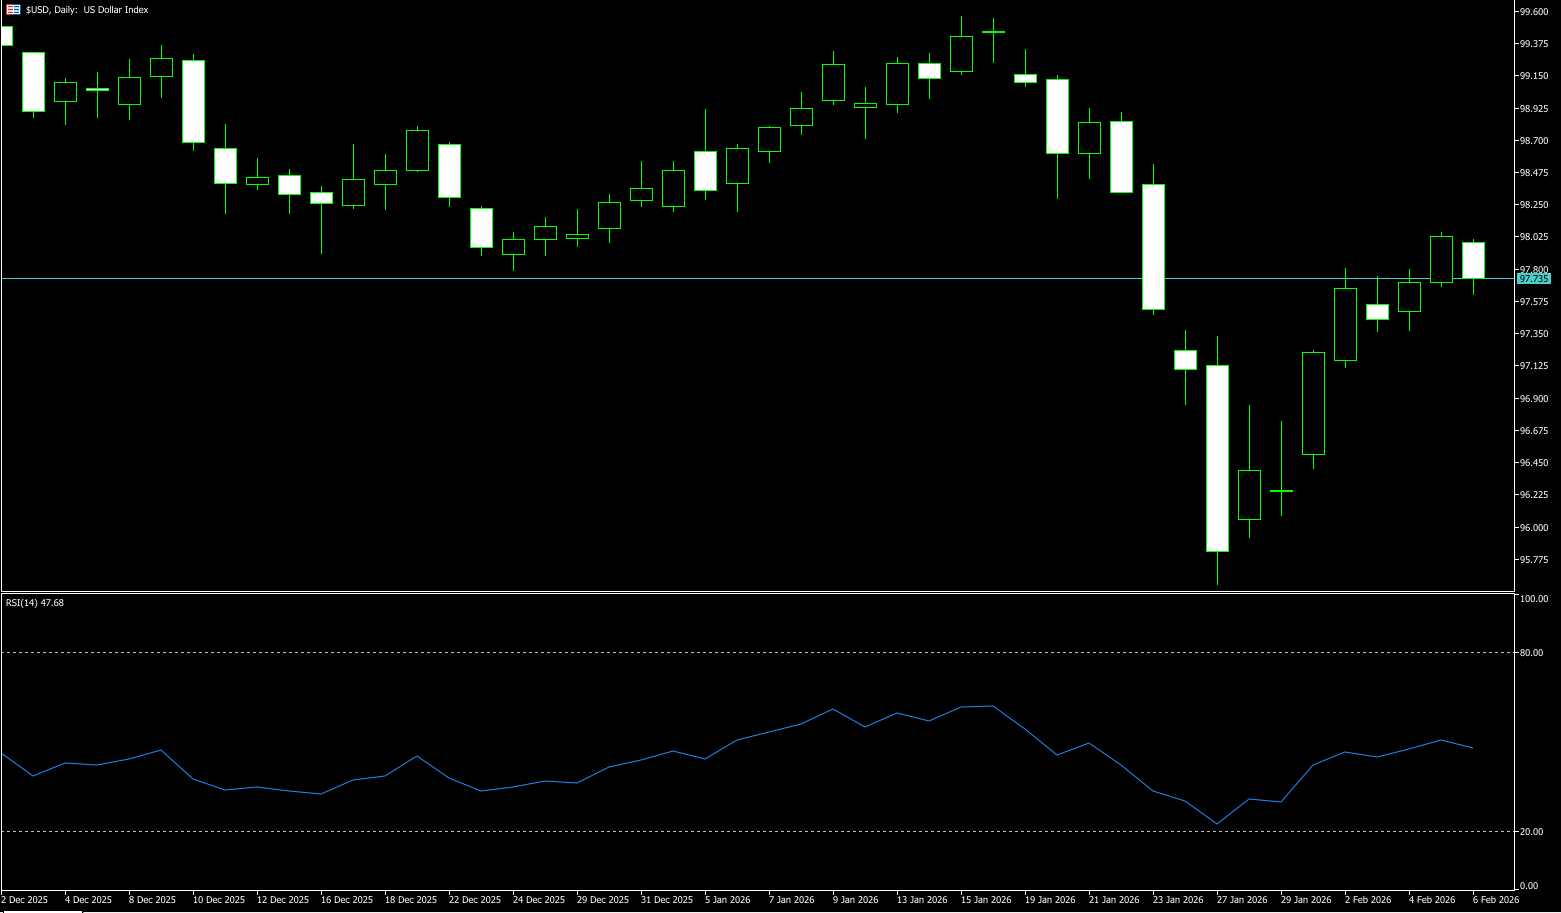
The US dollar index traded slightly below 98 last week, near a two-week high, as a broad sell-off in stocks, commodities, and cryptocurrencies boosted demand for the currency. The dollar has risen sharply since President Donald Trump nominated Kevin Warsh as the next Federal Reserve Chairman, as Warsh favors a smaller balance sheet and a more cautious approach to policy easing. The dollar index generally trended upwards last week, supported by fundamental factors such as the delayed expectation of a Fed rate cut and a dovish decision from the Bank of England. Technically, the short-term rebound momentum is strengthening but has not yet broken through key resistance, remaining in a range-bound pattern. US economic data: Marginal improvements in US economic data provided some support for the dollar. However, January's ADP private sector employment increased by only 20,000, far below market expectations of 45,000, indicating a significant slowdown in the labor market, which limited the dollar index's rebound. CME interest rate futures data showed an increased probability of the Fed holding rates steady in March, supporting the dollar index's rebound. On the other hand, the Fed is still in a rate-cutting cycle, and further declines in the federal funds rate will weaken the yield advantage of dollar assets. Meanwhile, structural factors such as the widening US government fiscal deficit and the continued progress of global "de-dollarization" make it difficult to fundamentally change the medium- to long-term weak trend of the US dollar.
Last week, the US dollar index showed a volatile rebound trend, briefly falling slightly below 98 during the week, approaching a two-week high. While the bulls were in control, their upward momentum was insufficient, and the index is likely to continue its consolidation in the short term, awaiting a breakout of key price levels to confirm its direction. The daily chart's RSI (14) is in the neutral range (47-50), leaning towards the bulls, but not fully dominant, and lacking upward momentum. The MACD is below the zero line, with the death cross momentum weakening and signs of a golden cross appearing. Below the zero line, the green bars are shortening, weakening the bearish momentum, and the sustainability of the rebound remains to be seen. Additionally, the 5-day and 10-day moving averages are in a golden cross, with 97.00 being a key support level. Short-term support is effective, but the medium-term trend is unclear. In the short term, the index is likely to remain in a range of 97.00 (integer level) - 98.69 (89-day simple moving average). If the price breaks through and holds above the psychological level of 98.00, the upward trend can be confirmed. A break below this level would target the 98.69 (89-day simple moving average) - 99.00 (round number) range. Conversely, a break above 97.30 (the small double bottom formed last Tuesday and Wednesday) would test the 97.01 (last week's low) and 97.00 (round number) areas, potentially retreating to the 96.12 (January 30th low) level.
Today, consider shorting the US Dollar Index near 97.75; Stop loss: 97.85; Target: 97.30; 97.40
WTI Crude Oil
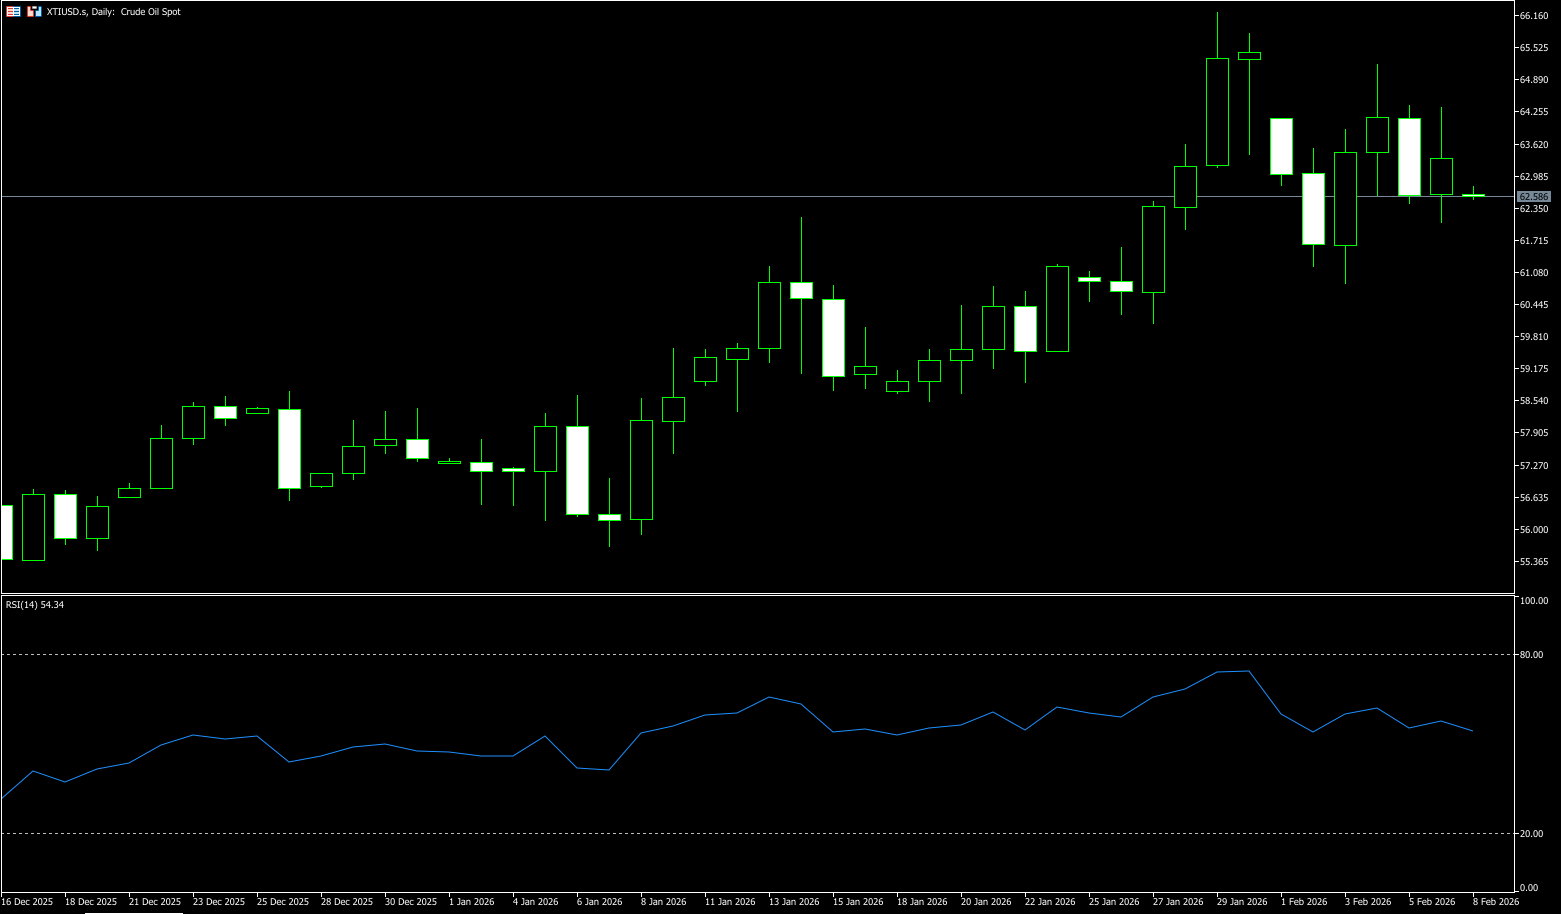
Last week, US-Iran negotiations pressured oil prices as traders weighed profit-taking against supply risk hedging. Tensions in the Strait of Hormuz and fluctuating diplomatic signals pushed up crude oil prices last week. The U.S. Energy Information Administration (EIA) reported a larger-than-expected drop in crude oil inventories, providing support for oil prices amid a decline in geopolitical risk premiums. Last week, oil prices fluctuated wildly: at the beginning of the week, prices plummeted after President Trump stated that the U.S. and Iran were engaged in dialogue; mid-week, media reports of a potential breakdown in negotiations caused prices to jump. Previously, tensions in the Strait of Hormuz had been high, with the U.S. Navy shooting down an Iranian drone. Before the weekend, traders took profits, causing prices to fall. While news of U.S.-Iran negotiations reduced geopolitical risk premiums, the EIA's inventory data provided support for oil prices. For the week ending January 30, the EIA report showed a decline in both crude oil and distillate fuel inventories, exceeding market expectations, while gasoline inventories increased during the same period. With ongoing U.S.-Iran negotiations, the upside potential for oil prices is likely to be limited below the $66.00-$66.25 resistance zone.
From the daily chart, the current main trend for U.S. crude oil is upward. Prices rebounded after hitting a low of $54.88 (the low of last December) and are currently still in an upward structure. A break above the $66.24 (this year's high) - $66.00 (a psychological level) resistance zone would reconfirm the strong upward trend; conversely, a break below the $60 support level would reverse the main trend. The upward trendline formed from the January 7th low of $55.65 is currently rising at a rate of $0.36 per day, with the current dynamic support level in the $61.59 (20-day moving average) - $61.00 (a psychological level) area. This trendline is a crucial defense level for the short-term bulls; a significant breach could trigger an accelerated pullback. The daily RSI has fallen back to the neutral zone, around 55, with no obvious overbought or oversold signals, indicating a balance between bulls and bears. While the MACD is bullish, its momentum is weak, suggesting intense competition between bulls and bears. The core support zone is between $61.55 (20-day moving average) and $61.00 (psychological level). This, combined with the psychological level of $60.00 and the 50-day moving average of $59.31, forms a dense support area. The core resistance zone is between $65.23 (last week's high) and $65.00 (psychological level). This trendline is a crucial defense level for short-term bears; a break below this level could trigger a rapid rise to $66.24 (this year's high). A further break could target $68.97 (last August's high).
Today, consider going long on crude oil around $63.18; stop loss: $63.00; target: $64.50; $64.80
Spot Gold
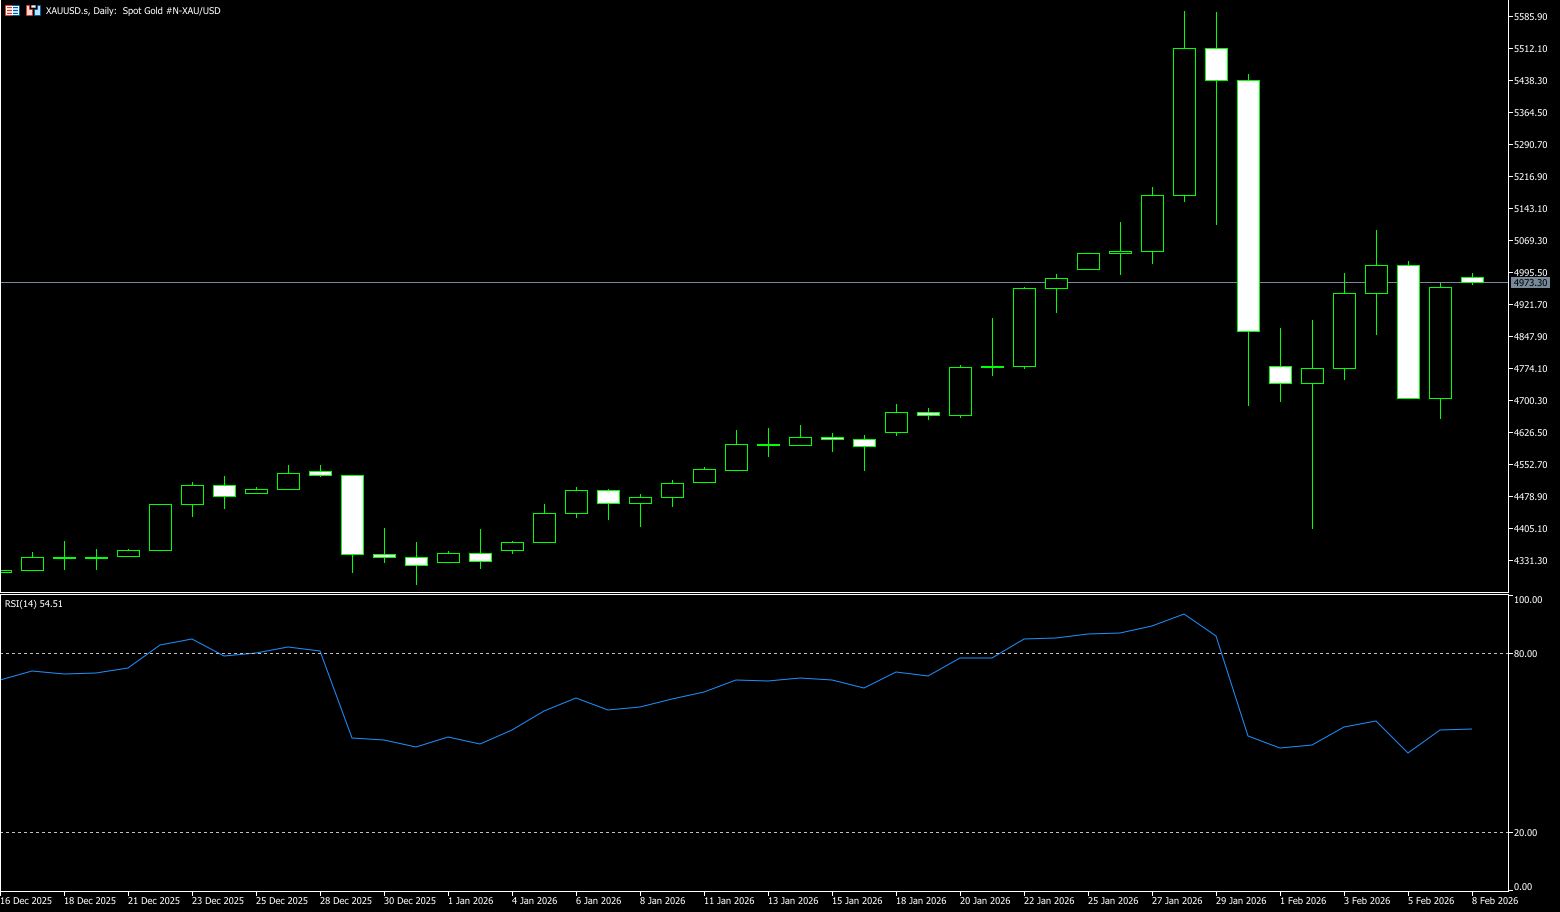
Gold prices experienced significant volatility last week, with a rollercoaster-like price action that was difficult for investors to predict. Currently trading below $5,000 per ounce, gold is poised for a weekly gain after a week of sharp fluctuations. Signs of a slowing US economy and ongoing geopolitical uncertainty, coupled with the consequences of forced selling, fueled market volatility. This rebound followed a wave of liquidations in late January triggered by increased margin requirements and a sharp sell-off in silver, which then spilled over into precious metals, causing prices to fall before buyers re-entered the market. This pullback occurred after the metal repeatedly hit record highs in January, primarily driven by heightened geopolitical risks, concerns about the Federal Reserve's independence, and speculative buying from China. Easing geopolitical tensions, with Iranian and US officials confirming talks in Oman, also impacted gold's safe-haven appeal, with investors closely monitoring the negotiations. Meanwhile, the White House stated that diplomacy is President Trump's preferred approach to Iran but warned of military options. This pervasive geopolitical risk further supported safe-haven gold. Additionally, some selling of the US dollar provided further support for precious metals. However, market expectations that incoming Federal Reserve Chairman Kevin Warsh may be less dovish could limit the rise of this non-yielding precious metal, so caution is advised before further positioning.
Last week, spot gold experienced a sharp drop followed by a rapid rebound, exhibiting an overall pattern of "bottoming out and then consolidating at high levels." The medium-term uptrend structure on the daily chart remains unchanged, while the short-term market is in a period of consolidation and directional choice. Last week, profit-taking caused gold prices to plummet to $4,402, followed by a gradual rebound over three days and consolidation at high levels. Before the end of the week, it dipped to around $4,650 before a rapid rebound, forming a long lower shadow, indicating effective support. Technical indicators show the RSI rising above 50, the MACD histogram shortening, bearish momentum weakening, and the 5-day and 10-day moving averages showing signs of convergence and turning downwards. The price held above the lower trendline of the upward channel (around $4,600), and the medium-term bullish framework remains intact. In terms of price action, the previous pullback did not break the upward channel, and the rebound at the end of last week strengthened the support level in the $4,600-$4,700 range, representing a healthy correction within an uptrend. If gold prices stabilize above $4,650 (last Friday's low) and break through $4,865 (the 20-day moving average) with significant volume, they are expected to advance towards $4,970 (the 14-day moving average) - $5,000 (the psychological level), potentially continuing the uptrend to $5,092 (last week's high) in the medium term. A break above this level would target $5.182 (the high of January 27th).
Consider going long on gold around 4,945 today; Stop loss: 4,935; Target: 5,000; 5,080
AUD/USD
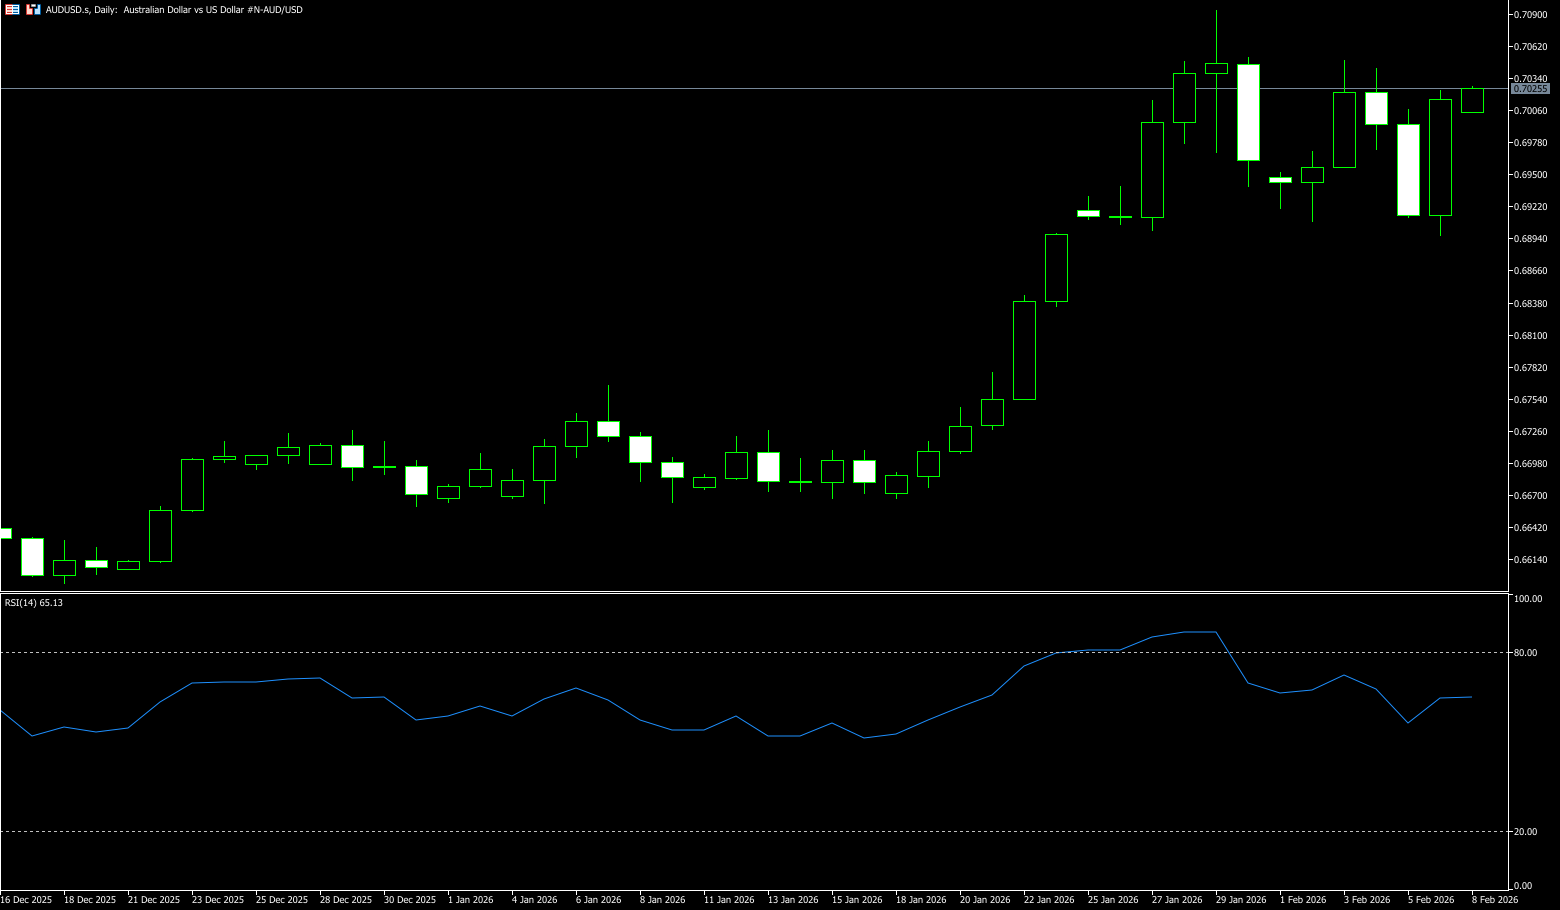
The Australian dollar rebounded above US$0.70 before the end of last week, having earlier retreated from a three-year high, pressured by a broad sell-off in global equities and risk-sensitive assets. Meanwhile, the Australian dollar struggled amid heightened risk aversion triggered by a pullback in tech stocks linked to heavy investment in artificial intelligence. The Australian dollar, often seen as a liquidity barometer of global risk sentiment, had been superseded by safe-haven assets. This commodity-linked currency, frequently used as a liquid proxy for global risk appetite, came under pressure after the tech-driven stock market crash, with investors uneasy about massive AI spending. This pullback also reversed gains earlier in the week when the Reserve Bank of Australia raised the cash rate by 25 basis points to 3.85% and indicated it might tighten policy further if inflation persists. Reserve Bank of Australia Governor Michelle Bullock reiterated that restrictive policies remain necessary to cool demand and ease price pressures. The market expects a 70% probability of a rate hike to 4.10% in May, and only a 50% probability of a further hike to 4.35% by the end of the year. The focus now shifts to next week's upcoming household spending data for further clues about the policy outlook.
The Australian dollar against the US dollar generally trended downwards and rebounded last week, with a core trading range of 0.6865-0.7050. Short-term bearish momentum weakened and the willingness to rebound increased, suggesting a generally bullish bias within a range. A breakout above key levels could warrant following the trend. Overall, the pair was pressured at the beginning of the week by a strong US dollar, stabilized after testing strong support at 0.6865 (the 20-day moving average) mid-week, and weakened bearish momentum before the weekend, increasing the probability of a bullish short-term trend. The daily chart shows that the Australian dollar has broken away from short-term moving average resistance, the RSI has rebounded from its lows but has not reached overbought levels, and the MACD histogram is shortening, indicating potential for a short-term rebound. Currently, the Australian dollar is trading within an ascending channel pattern against the US dollar, indicating a potential bearish reversal. The pair may test the immediate resistance level of 0.7050, last week's high. A decisive break above 0.7050 would strengthen the bullish bias, with a target of 0.7094, the highest level since February 2023, reached on January 29th. On the downside, strong support exists at the 0.6900 (psychological level) - 0.6865 (20-day moving average), which has been tested multiple times without breaking, casting doubt on the continuation of the downtrend. With the aforementioned support area breached by the bears, the next targets are the 0.6800 (psychological level) and the 0.6795 (34-day moving average) area.
Consider going long on the Australian dollar around 0.7005 today; Stop loss: 0.6995; Target: 0.7050; 0.7060
GBP/USD
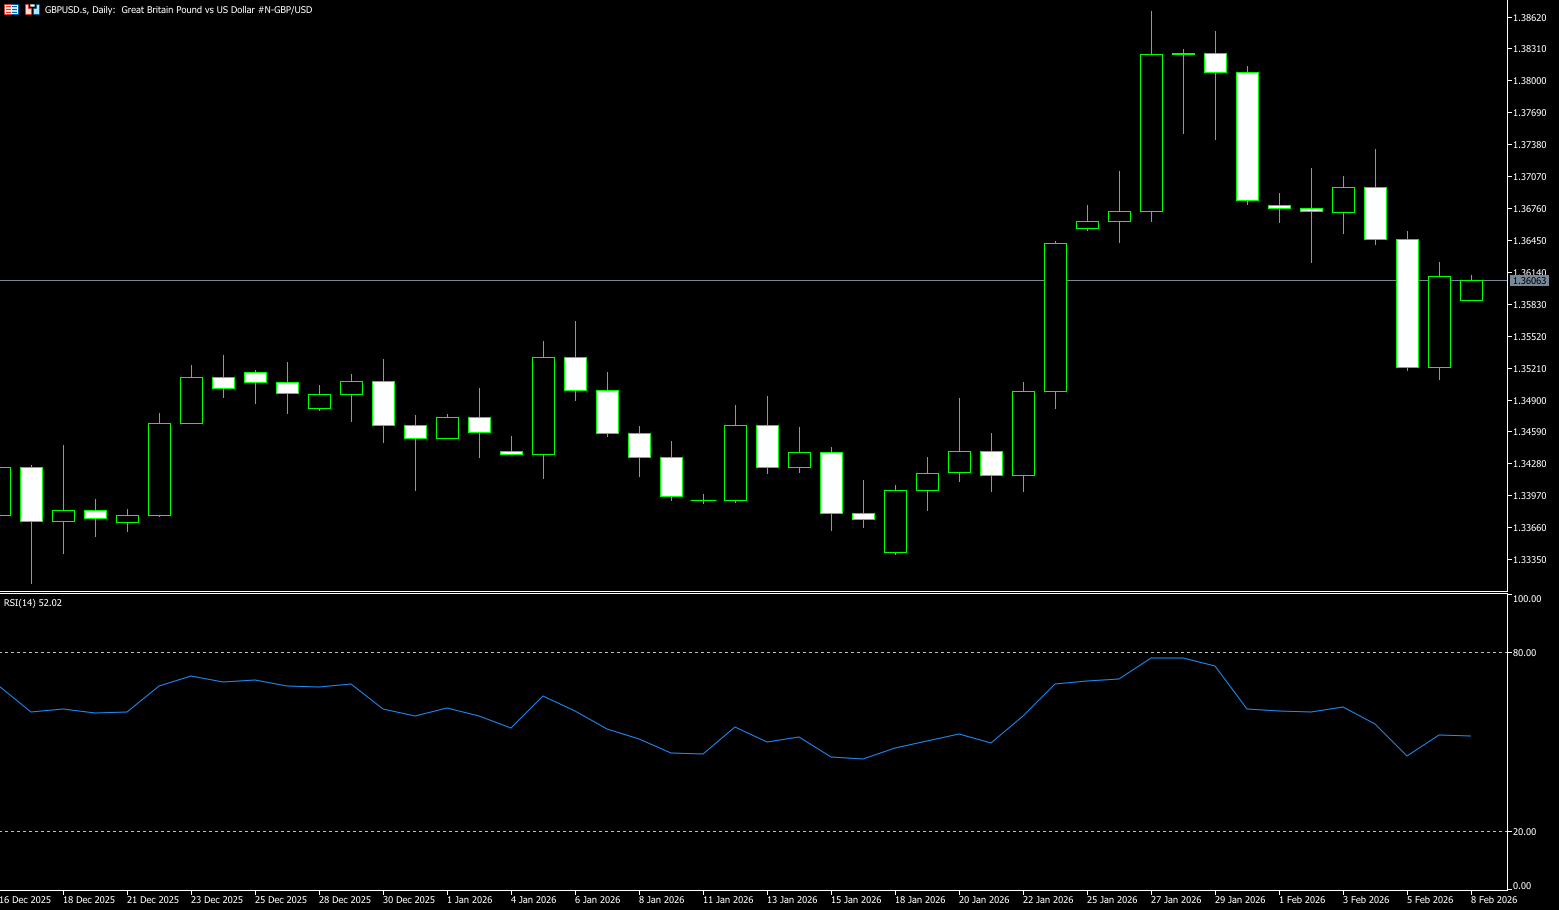
The GBP/USD pair is expected to close down 0.47% last week. The Bank of England kept interest rates unchanged but indicated it would cut rates if the deflationary process meets certain criteria. However, Bank of England Governor Andrew Bailey's rhetoric remained dovish, adding that he expects bank rates to fall further. Recently, Bank of England Chief Economist Hugh Peel stated that inflation falling to the target is good news and acknowledged that private sector growth was weak but still positive. In the US, weak jobs data on Thursday caused a delayed reaction in the foreign exchange market; the dollar rose on Thursday but gave back some of its gains on Friday. According to the Challenger report, fewer job openings, more layoffs, and a surge in unemployment claims have increased market expectations that the Federal Reserve will cut interest rates in 2026. Recently, the University of Michigan's consumer confidence index rose to 57.3 in February from 56.4, exceeding the expected 55. The one-year inflation expectation fell to 3.5% from 4%, while the five-year inflation expectation rose to 3.4% from 3.3%. Next week, traders will focus on US data, including non-farm payrolls and the Consumer Price Index (CPI), which were delayed due to the short-term government shutdown. In the UK, Thursday's GDP data and a speech by Bank of England Governor Andrew Bailey could influence the market, despite ongoing domestic political turmoil surrounding Prime Minister Keir Starmer.
Last week, the pound initially rose slightly against the dollar, then fell sharply after the Bank of England's interest rate decision, before rebounding somewhat before the weekend. Overall, the trend was downward with bears dominating, and key support and resistance levels were clear. Last week, the Bank of England kept interest rates unchanged at 3.75%, with a 5-4 vote and four members supporting a rate cut, sending a dovish signal and causing the pound to fall sharply against the dollar. On the daily chart, the exchange rate broke below the 5-day and 10-day short-term moving averages last week. The 20-day and 60-day moving averages provide some support in the 1.3573-1.3475 area. A continued breach of these levels would increase the downside risk in the medium term. The RSI rebounded before Friday, but this indicates that bearish momentum has not yet fully dissipated. The daily MACD has formed a death cross, with the green histogram bars continuing to expand, clearly signaling a bearish trend. Friday's rebound slightly shortened the histogram bars, but the overall trend remains unchanged. In the short term, the GBP/USD pair is dominated by bears, but the 1.3500 level offers strong support, and the rebound on Friday suggests a need for technical correction. Next week, it may consolidate within the 1.3500-1.3700 range. If the price can effectively hold above 1.3662 (last Thursday's high), it may then challenge the 1.3697 (10-day moving average) - 1.3700 (psychological level) area, and further, if it breaks below 1.3500, it will open up further downside to 1.3733 (last week's high). On the downside, the first target is 1.3553 (25-day moving average), followed by 1.3500 (psychological level), and a break below that would target 1.3475 (50-day moving average).
Today, consider going long on GBP/JPY around 1.3606; Stop loss: 1.3595; Target: 1.3650; 1.3670
USD/JPY
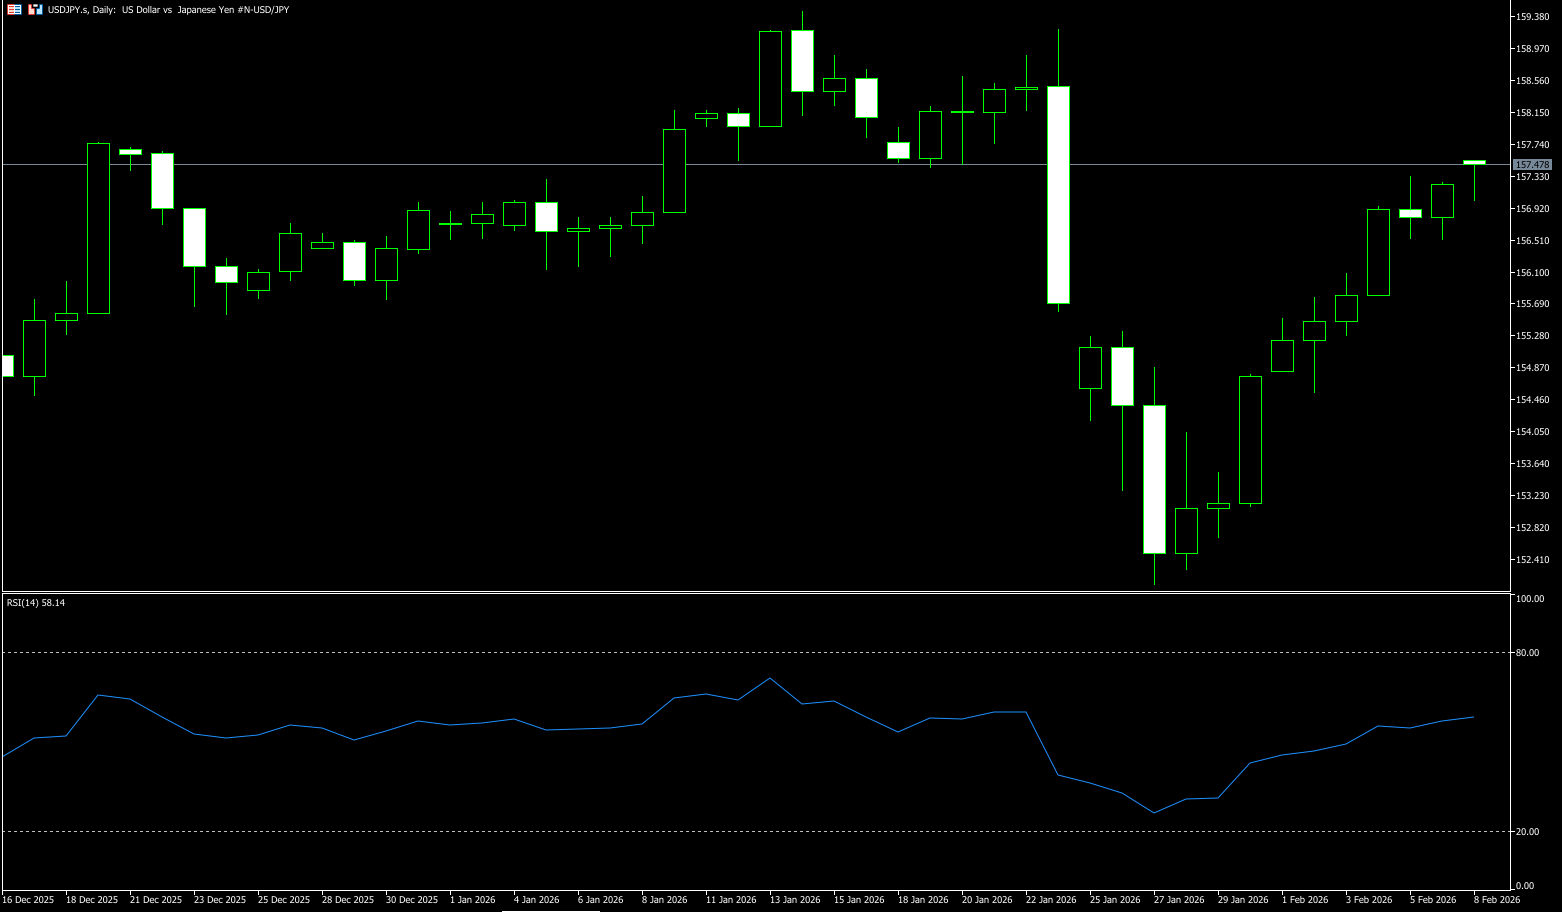
The USD/JPY pair held firm last week, with the yen being the weakest major currency for the second consecutive week. The pair is currently trading around 157.20, heading towards its strongest weekly performance since October. Investors are moving away from the yen ahead of this weekend's fast-paced election. Markets are wary of a potential strong victory for Prime Minister Takashi Masaki, which would give her stronger parliamentary support to implement her expansionary fiscal policies, given that the country has one of the largest public debts among developed nations. In the US, a series of weak jobs data has shifted market focus back to the Federal Reserve, with investors increasing their bets on further rate cuts in the coming months. Unemployment claims in the last week of January significantly exceeded expectations, while JOLTS job openings showed their weakest performance in five years. The key US non-farm payroll report has been postponed until next week due to the government shutdown. Later, Federal Reserve Governor Philip Jefferson may provide new hints about the central bank's monetary policy following this week's labor data. The yen is also preparing for this weekend's House of Representatives election. The currency came under pressure as Prime Minister Sanae Takaichi was expected to win voter support for increased spending and potential tax cuts, fueling concerns about Japan's fiscal outlook. Uncertainty surrounding how the government would finance its ambitious plans and how it would compensate for potential revenue losses weighed on the market.
Last week, the USD/JPY pair generally trended upwards with gradually rising lows and highs, maintaining its bullish structure. However, upward momentum slowed from mid-week, with increasing signs of high-level consolidation and weakening momentum. The daily chart shows short-term moving averages in a bullish alignment, with the price trading above them. 155.19 (the 89-day moving average) is key support, while 159.45 (the high since July last year) is short-term resistance. The daily RSI is around 55, above 50 but still out of overbought territory, indicating a narrowing safety margin for chasing higher prices and an increased probability of consolidation. Meanwhile, the MACD bullish momentum is contracting, increasing the risk of a short-term pullback. The USD/JPY pair has held above the 157.00 level (a psychological key level) and broken through with increased volume, potentially challenging the 157.89 level (the high from last November). A break above this level would then target 159.45 (this year's high). If USD/JPY breaks above 160, investors will be watching for potential intervention from the Treasury Department, which may take advantage of the lower liquidity during the Japanese holiday on February 11th. Conversely, a break below 156.54 (last Friday's low) and a breach of the 5-day moving average at 156.48 could lead to a pullback to the 155.19 (89-day moving average) - 155.00 (psychological key level) range, potentially indicating a weakening of the bullish structure and a move towards the next target of 154.44 (100-day moving average).
Today, consider shorting the US dollar around 157.30; Stop loss: 157.50; Target: 156.30; 156.20
EUR/USD
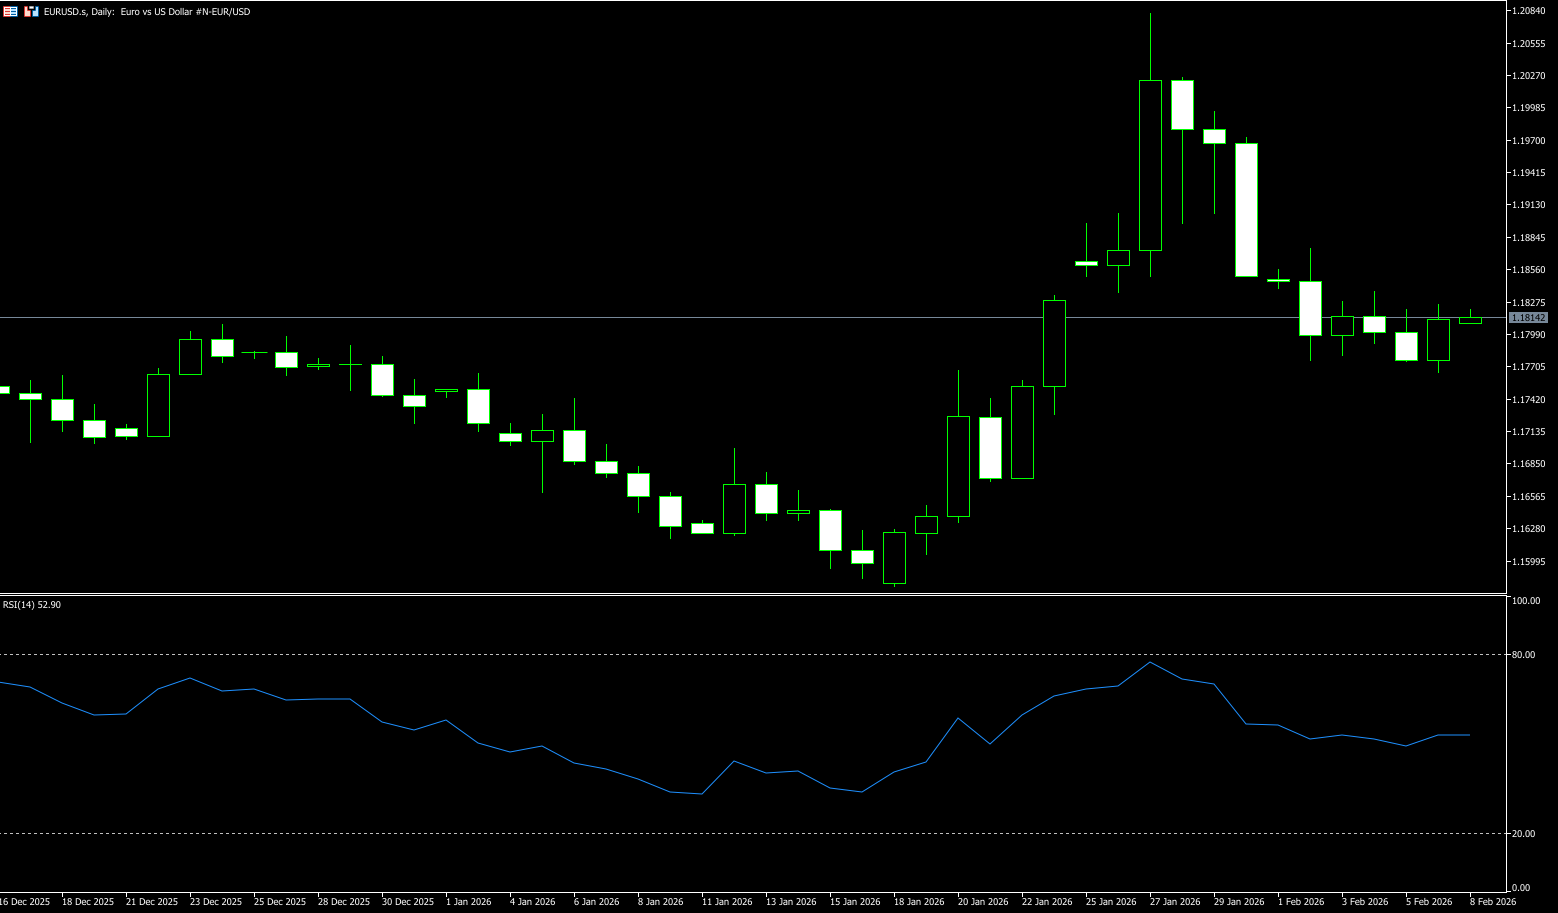
The EUR/USD pair reached a high of around 1.1820 before the end of last week. The pair rose due to renewed weakness in the US dollar and increasing market discussion about a possible Fed rate cut in March. On the agenda, the preliminary reading of the US consumer confidence index for February improved to 57.33. Late last week, the euro found some respite against the dollar, which retreated after a brief two-day rally, erasing mid-week gains, as indicated by the dollar index. Risk appetite weakened the dollar's safe-haven appeal, and Thursday's lackluster ECB monetary policy decision left traders reliant on market sentiment. The euro is expected to end the week with a loss, but EUR/USD appears poised to consolidate within the 1.1750-1.1850 range. US economic data indicated improved consumer confidence in February, but failed to boost the dollar. Thursday's weak jobs data fueled speculation that the Federal Reserve might cut interest rates more than twice this year. In Friday's trading, the money market priced in 62 basis points of easing before retreating to 54 basis points, according to Prime Market Terminal data. Additionally, the euro/dollar exchange rate has risen 1.18% over the past month and 14.37% over the past 12 months. The euro as a currency only began circulating on January 1, 1999. However, by considering weighted averages of previous currencies, a synthetic historical price model can be created from much earlier periods.
The euro/dollar pair saw a surge followed by a pullback last week. Technically, the market is in a balanced state, and in the short term, it is likely to continue consolidating within the 1.1735 (50-day moving average) - 1.1874 (last week's high) range. A breakout of this key level is needed to initiate a new direction. After surging to 1.1874 at the beginning of last week, the price fluctuated downwards, repeatedly trading within the 1.1770-1.1820 range during the week. It bottomed out at 1.1765 before a slight rebound at the end of the week, exhibiting an overall "surge followed by pullback - low-level consolidation" pattern. The weekly chart is likely to close with a small bearish candle or a doji. The overall trend was downward with balanced forces between bulls and bears, suggesting a high probability of short-term consolidation. The daily RSI hovered around 50-55, indicating balanced forces with no obvious overbought or oversold signals. The MACD was below the zero line, with persistent green bars, suggesting a bearish bias but weakening downward momentum; the bearish momentum was weakening, and the willingness to rebound was increasing. Currently, the exchange rate has broken below the 9-day moving average of 1.1864. Short-term moving averages are in a bearish alignment, while medium-term moving averages are flat, indicating a clear consolidation pattern. Therefore, the price is likely to continue trading within the 1.1735-1.1874 range in the short term, with the direction depending on the strength of the US dollar and the ECB's policy signals. If the US dollar index continues to strengthen, the euro may test support at 1.1735 (50-day moving average) and 1.1700 (psychological level). A break below these levels would target the 1.1677 (50-day moving average) level. Conversely, if the ECB releases hawkish signals or the dollar weakens, the euro is expected to rebound and test the resistance zone of 1.1864 (9-day moving average) - 1.1874 (last week's high). A break above this level would target the 1.1900 (psychological level).
Today, consider going long on the euro near 1.1810; stop loss: 1.1800; targets: 1.1860, 1.1870.
Disclaimer: The information contained herein (1) is proprietary to BCR and/or its content providers; (2) may not be copied or distributed; (3) is not warranted to be accurate, complete or timely; and, (4) does not constitute advice or a recommendation by BCR or its content providers in respect of the investment in financial instruments. Neither BCR or its content providers are responsible for any damages or losses arising from any use of this information. Past performance is no guarantee of future results.
Lebih Liputan


Pendedahan Risiko:Instrumen derivatif diniagakan di luar bursa dengan margin, yang bermakna ia membawa tahap risiko yang tinggi dan terdapat kemungkinan anda boleh kehilangan seluruh pelaburan anda. Produk-produk ini tidak sesuai untuk semua pelabur. Pastikan anda memahami sepenuhnya risiko dan pertimbangkan dengan teliti keadaan kewangan dan pengalaman dagangan anda sebelum berdagang. Cari nasihat kewangan bebas jika perlu sebelum membuka akaun dengan BCR.
BCR Co Pty Ltd (No. Syarikat 1975046) ialah syarikat yang diperbadankan di bawah undang-undang British Virgin Islands, dengan pejabat berdaftar di Trident Chambers, Wickham’s Cay 1, Road Town, Tortola, British Virgin Islands, dan dilesenkan serta dikawal selia oleh Suruhanjaya Perkhidmatan Kewangan British Virgin Islands di bawah Lesen No. SIBA/L/19/1122.
Open Bridge Limited (No. Syarikat 16701394) ialah syarikat yang diperbadankan di bawah Akta Syarikat 2006 dan berdaftar di England dan Wales, dengan alamat berdaftar di Kemp House, 160 City Road, London, City Road, London, England, EC1V 2NX. Entiti ini bertindak semata-mata sebagai pemproses pembayaran dan tidak menyediakan sebarang perkhidmatan perdagangan atau pelaburan.

 English
 简体中文
简体中文
 繁體中文
繁體中文
 Bahasa
Melayu
Bahasa
Melayu
 Tiếng
Việt
Tiếng
Việt
 ไทย
ไทย
 日本語
日本語
 한국어
한국어
 ភាសាខ្មែរ
 español